
Since ScaleGrowth is built around a very powerful AI Personalization & Recommendation Engine, we track all the user activity across page visits, content views, and related user interactions. As a ScaleGrowth Customer, you can get detailed view into this, with powerful Data Search & Filtering capabilities to "zoom in" and drill down into the areas of Content that are most insightful for your business.
Here is how you can do this:
Accessing Relevant Dashboards
- log in with your Admin account
- Enter Admin if you aren't already
- navigate to Manage
- under the Content section, you will see Dashboards for the four major Content Types,
- including Forum Posts, Resources, Events, and custom Listings (including for Classifieds or Marketplaces):
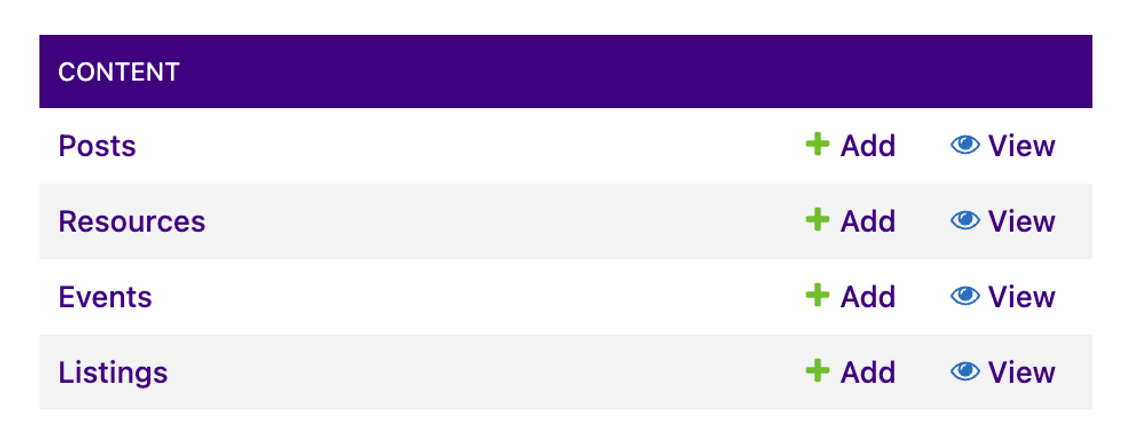
- click into one of these Content Dashboards
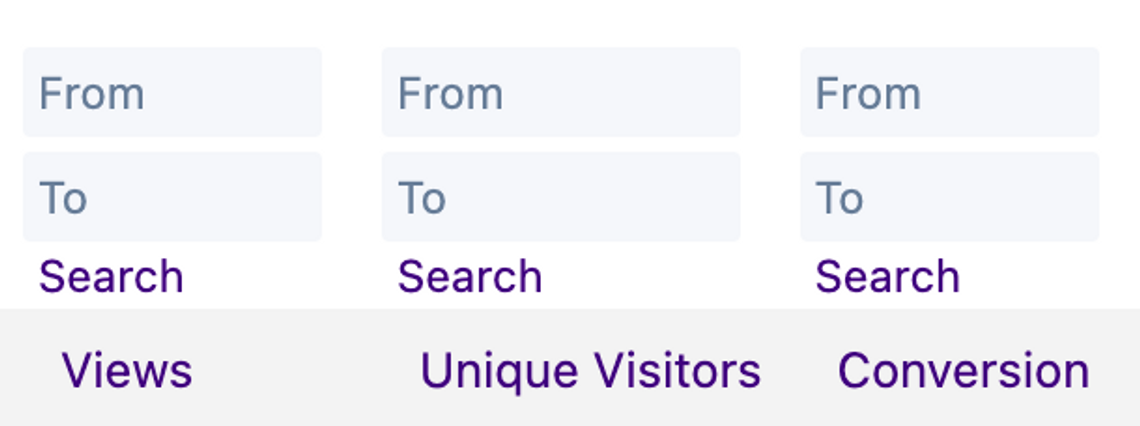
- then, look for the Columns titled Views, Unique Visitors, and Conversion:
Legend / Definitions
- Views – total number of times someone has visited the Details View of this piece of content
- That is, the dedicated landing page for just that piece of content, which is also what is linked if you Share it
- Unique Visitors – total number of unique User Accounts or No Account anonymous visitors (if your access permissions allow them) who have visited the Details View of this piece of content
- Unique Visitors is essentially Views de-duplicated across the same user visiting the same piece of content repeatedly
- Conversion – total number of primary CTA [Call To Action] button or link clicks by users for this piece of content
- Primary CTA clicks differ by content types – for Events, these are typically RSVPs, for Resources, clicks out to read an external article, download a file, or watch the video, while for Listings these are typically Transactions (such as clicking to apply for a Job Listing on a Job Board)
- Please note that all three of Views, Unique Visitors, and Conversion numbers only count the corresponding interactions on the Details View for each piece of content
- This is different from Impressions – which is when the summary tile for this piece of content shows up in the Space feed, the Home Feed, or any other aggregated views
- Additional Impressions-based analytics are coming soon to these Dashboards – so watch this space!
Analyzing the Data
- First, you can optionally find a Column to filter the content by Space under the Space Column
- If you do not do this, you will be looking at the aggregate dashboard across all content of the corresponding type
- Additionally, many of the data Columns offer handy & powerful Filters you can apply
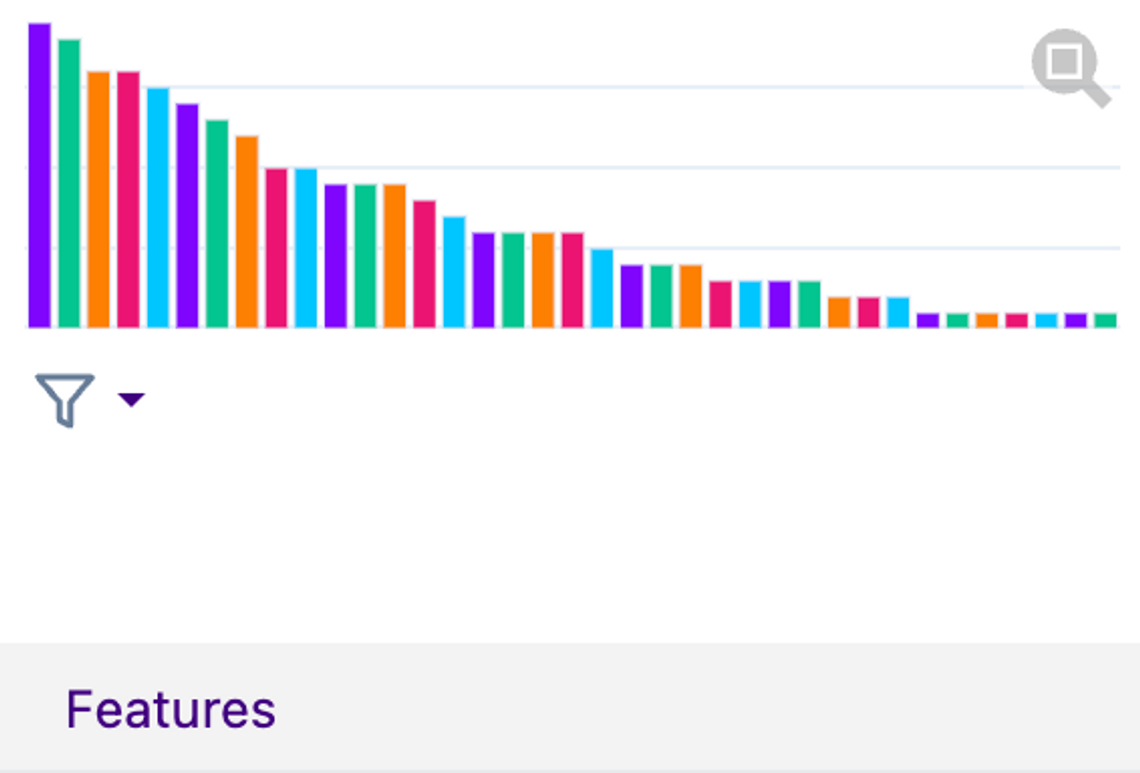
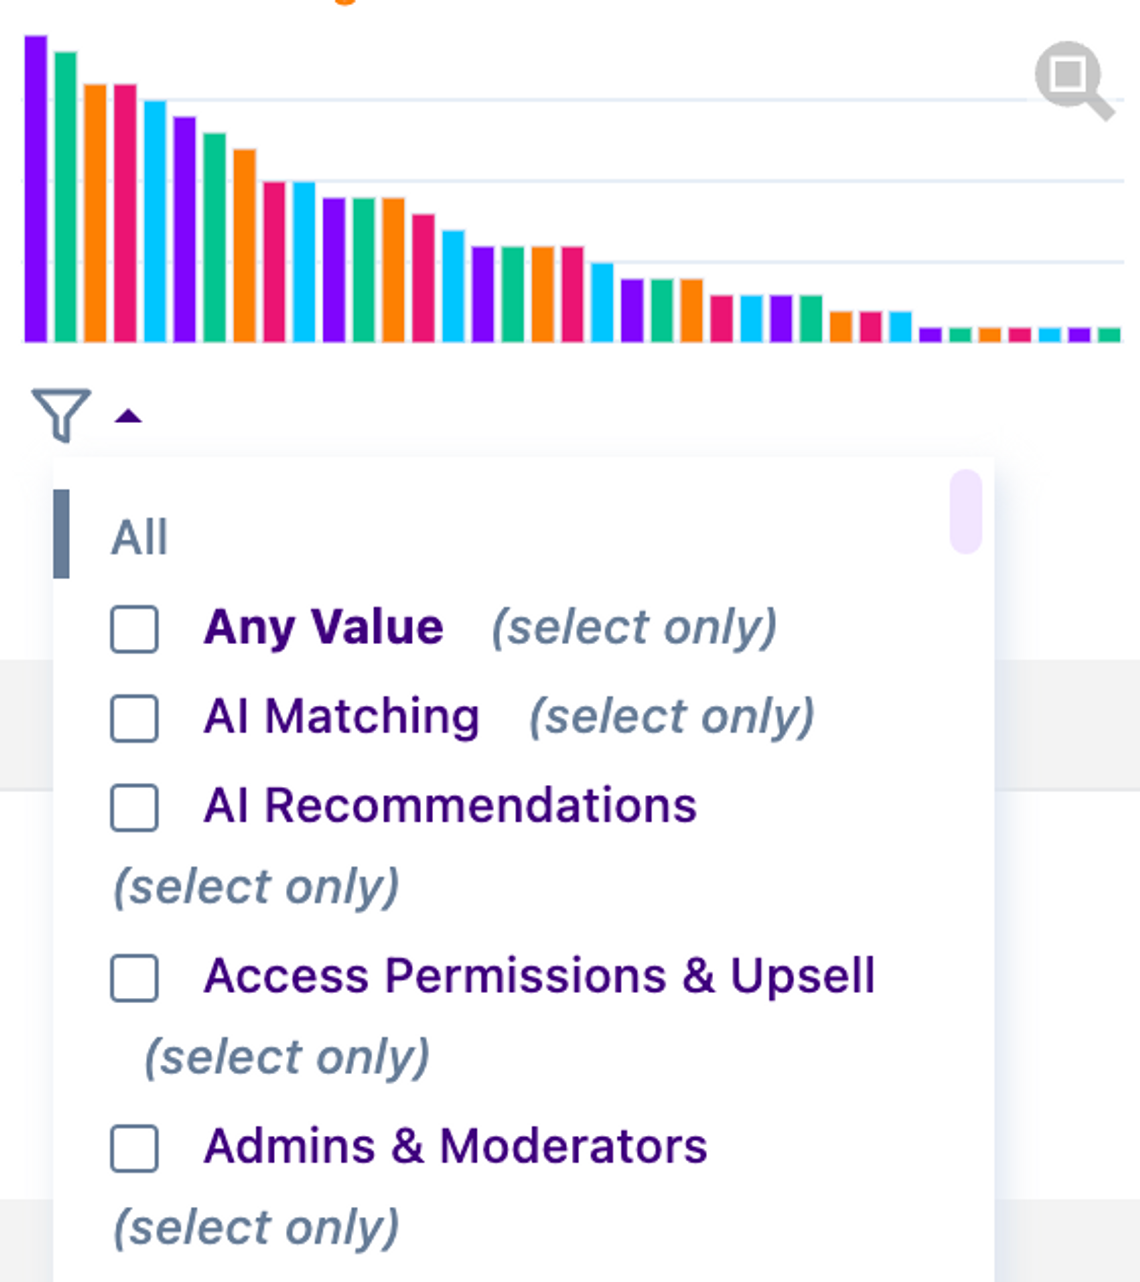
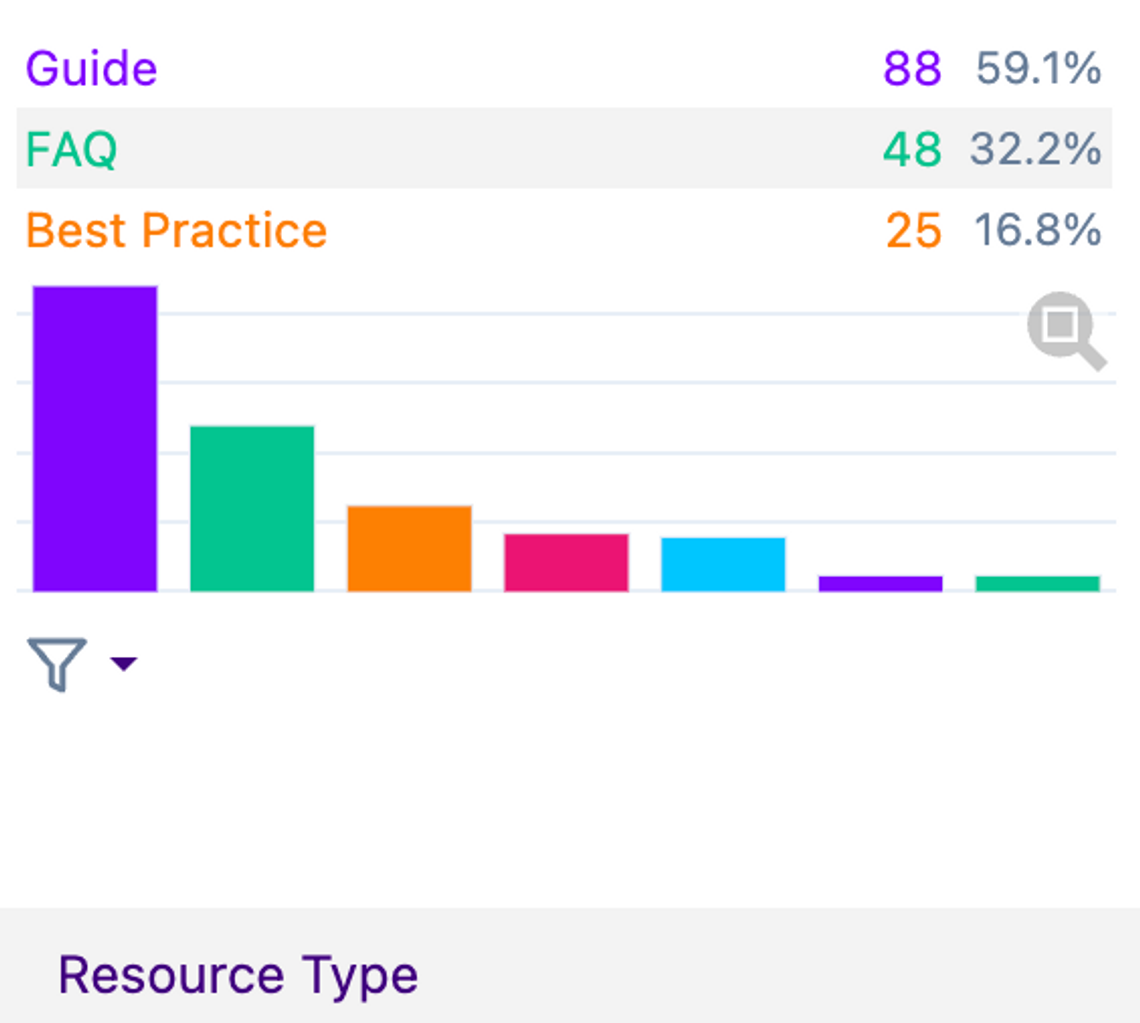
- Note also how most Columns have "Instant Insights" generated by our AI
- These show you the visual graphs of the data distribution across the current results set
- Clicking on of the graphs will take you to a modal view where you can see greater details of the breakdown
- Above the graph, you can also see the top 3 most popular values for that particular Column
- Note that when you apply any Search Filters – such as by Space – all the "Instant Insights" Dashboards will update
- They will now reflect the
newbreakdown across thefilteredset of results - You can combine any number of Search Filters on top of each other
- This way, you can keep "Zooming In" and "Drilling Down" into the areas of your ScaleGrowth Solution you want to explore
- Now let's locate the Views, Unique Visitors, and Conversion Columns again
- You can click on each of these Column titles to Sort / Order the results by it
- Clicking the Column title again will reverse the Sort Order
- Note that if you have applied any Search Filters, you will be sorting results across just that
filteredset of data - This is a great way to determine most popular pieces of content within you ScaleGrowth Solution
Should you have any questions about how to used these Dashboards or best practice approaches to get certain insights, our team is here to help – simply head into Your Success Center and post your question under Ask SG Team!
